Keltner Channel Bands are another part of my personal day trading strategy that I have been using for over 10 years now. They were invented by a man named Chester Keltner in the 1960’s and have been widely used by thousands of traders around the world. They are calculated using the volatility of the high and low prices in the stock or market that you are applying them to. They are similar to Bollinger bands used in the MACD BB indicator, the only difference is that the bollinger bands rely on the standard deviation.

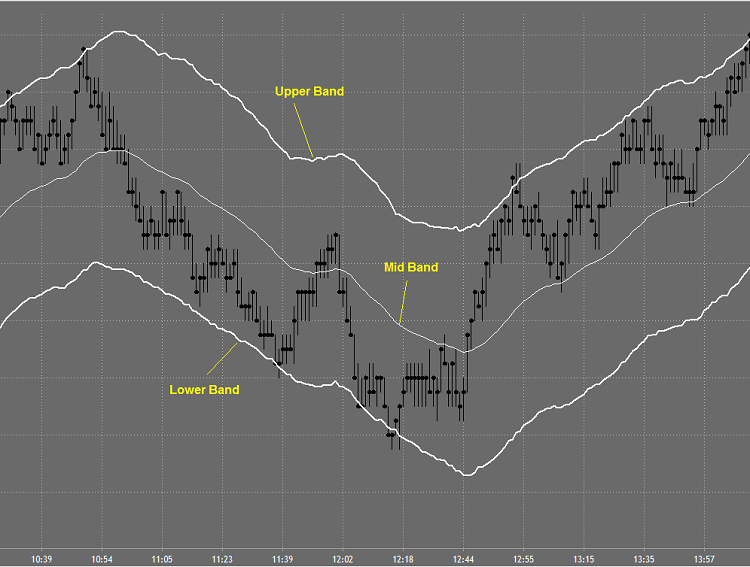
keltner channel bands
One of the biggest things that the Keltner Channel Bands for day traders is to allow them to frame price. Most day trading indicators are used to gauge strength and weakness while the channel bands allow traders to get an idea where the market is heading. This allows a person to know when to get in and out of the market as the channel bands can also be used as profit targets. I have been using the channel bands for roughly 10 years in my own personal trading strategy, if you want to see my results have a look at the income statements posted on the site.
Another aspect of the Keltner Channel Bands is allowing you to gauge areas of support and resistance and even momentum. While the analysis of these tools has progressed over the last 50 years, many have noticed the importance of the areas and how the market respects the channel bands. Others use the areas to act as a barrier to gauge momentum, whenever you break above or below the certain bands you can start looking for trades in the opposite direction.
If you want to learn more about how to use the bands sign up for my email newsletter and receive updates on my coaching program. I am even teaching someone via my learning how to day trade project to show everyone how easy it is to get started day trading.