When you think of Fibonacci software you normally think of automated day trading software. The secret I am here to tell you is that all the Fibonacci software in the world can be found for free with two indicators. Fibonacci software is simply an automated process of patterns that are recognized in the market. The very first software program that I bought was an automated Fibonacci software that I stopped using because I was never taught regular market principles in order to use the software effectively. I later realized that I paid over $7,000 for something that could have done for free.
What most Fibonacci Software does is automate the process of finding clusters of Fibonacci areas. All of the Fibonacci areas can be found with Fibonacci retracements & extensions. The secret that day trading companies don’t tell you is all you have to do is look at both the macro and micro level of the market. Lets look at a live example:

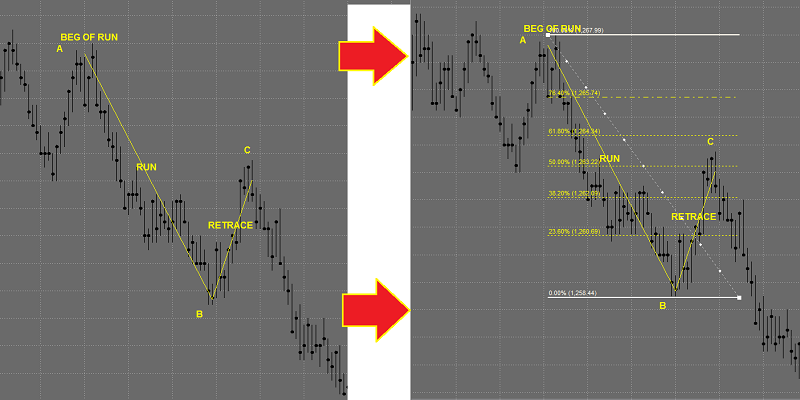
An extension is simply the length of a retracement plus the length of the original run. This is also just the small scale as we are looking at the micro view of the market, or zoomed in very close. After we see larger runs in the market we apply the same principle that we see below on larger moves and only pay attention to the larger moves and then combine them with the smaller moves in order to get our most powerful areas.

Once we zoom out we can look at both short term and long term moves in order to find a cluster of fibs which are the “famous proprietary” resistance and support area that everyone talks about. Below you can see a more precise explanation of the Fibonacci using the macro and micro approach. Play very close attention to the series of charts below which show exactly how these areas are drawn.

Above you will find a normal trending market that is headed to the downside. Correlate the numbers with the pivots and you are going to find the small runs and retracements that are part of the larger, overall trend, down.
- Anchor: Beginning of the run
- Pivot: Where run ends and retracement begins
- Retracement: Where buyers come into market and stop run down

I’ve circled all of the major clusters of fibs where the market is expected to either slowdown or pivot. This is how most Fibonacci software’s are designed and guess what? You do’n’t have to pay a dime for it. Have alook at the very last chart below as I clean up the areas and line up the support and resistance areas.

Voilah!
