Time based day trading charts are mostly used in conjunction with other charts but there are some day traders that use time based charts exclusively. For shorter time frame trading such as intraday trading the 5 minute, 10 minute, and 15 minute charts are very popular. For swing traders or longer term traders a daily or weekly chart may be used.
Advantages of Time Based Trading Charts
I looked into trading several time based charts due to the fluid movement. One of the biggest advantages of time based trading is when there is high volatility and movement you won’t see as many oscillations and snapping back and forth with the minute charts. This is helpful because when the market really starts to move it can be difficult to see entries and exits.
Disadvantages of Time Based Trading Charts
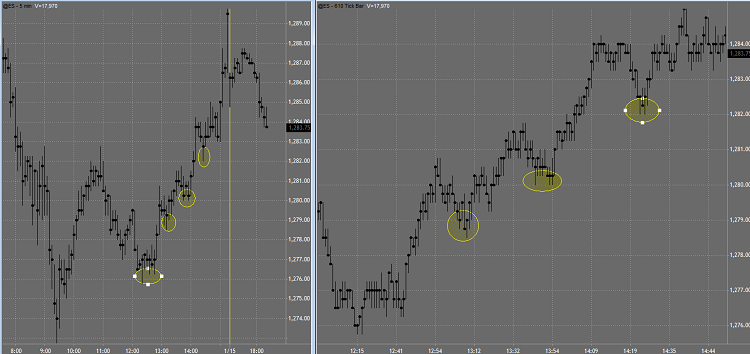
On the other hand, the loss in movement is also a disadvantage because you wont’t be able to take advantage of those extra moves. I prefer to be out of the market as much as possible to be able to take advantage of extra moves and make more profit. Have a look at the chart below, there is a 5 minute chart on the left & a 610 tick chart on the right.

time based charts
Now I could show you a 10 minute charts as well but that would only make the movement in the market smaller. With the wild fluctuations that we have seen in the market, it is much easier to identify pullbacks for entries and slowdowns for exits when you compare the two charts above. This is the main reason that I trade tick charts over time based charts in my own personal trading strategy.
You can also used time based charts for volume but I have found that focusing on the actual movement of the market you can really identify the strength and the amount of momentum on any given day. I personally don’t use any time based charts since I only focus on trading tick charts.